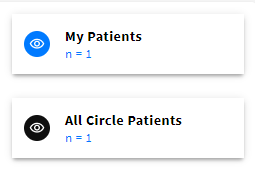
Once the Report Template has been created, you'll see two default cohort filters on the right. The first one – My Patients - (marked with a blue eye) displays only your patients' data, while All Circle Patients (marked with a black eye) displays the data of all the cases created within your Circle, i.e., your patients + the patients of all your Circle members. But all the Cohorts are totally customizable, and you can select any option for any Cohort filter to display.
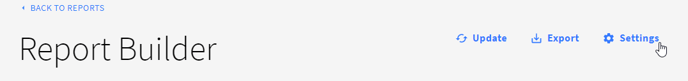
To start working with cohorts, click Settings at the top right of the Report Builder
Adding a Cohort
1. Click ADD COHORT at the bottom of Graph Settings and the newly added cohort will open immediately
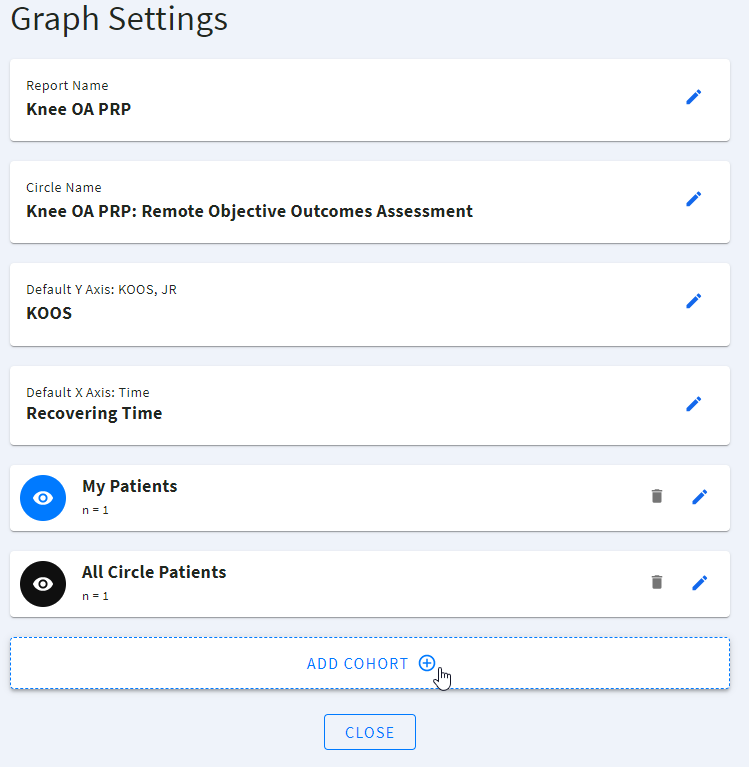
2. Now you can configure the cohort according to your preferences
Removing a Cohort
1. Open Settings on the Report Builder page
2. Click  next to the cohort you want to delete

3. Confirm deletion by pressing REMOVE
- Press CANCEL to cancel the deletion

Switching Off a Cohort
You can switch off the cohort line on the graph without deleting it.
To do so, click on ![]() near the required cohort and it will disappear from the graph.
near the required cohort and it will disappear from the graph.
To switch on the cohort, go to the Graph settings and click ![]() next to the switched off cohort.
next to the switched off cohort.