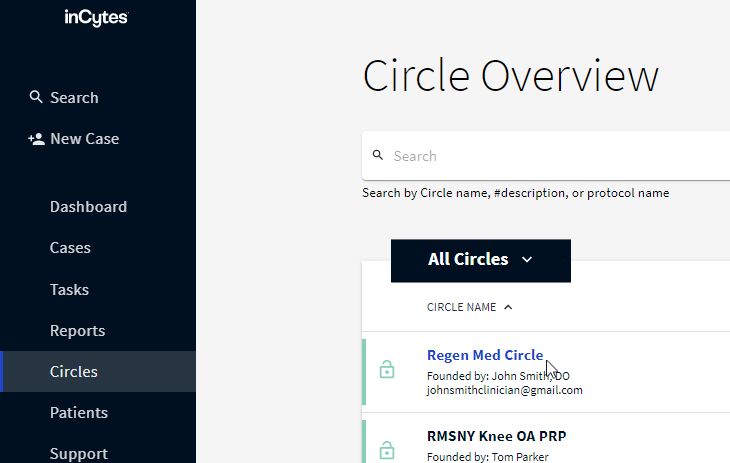
- Navigate to Circles and select the required one from the list
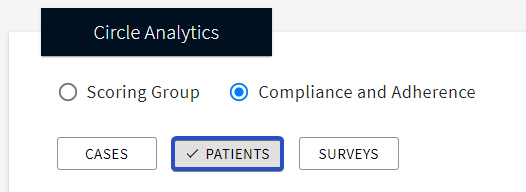
2. In the Circle Analytics field, select Compliance and Adherence → PATIENTS
3. The graph divided into one-week periods will display. There’re two columns for each period:
The statistics in the graph only include patients who have provided an email and/or mobile phone in their contact information and meet the following criteria:
- They joined the platform by invitation or self-enrollment link.
- They enrolled in active cases, either open or completed, with a case commencement date within the specified period. Archived cases are not included.
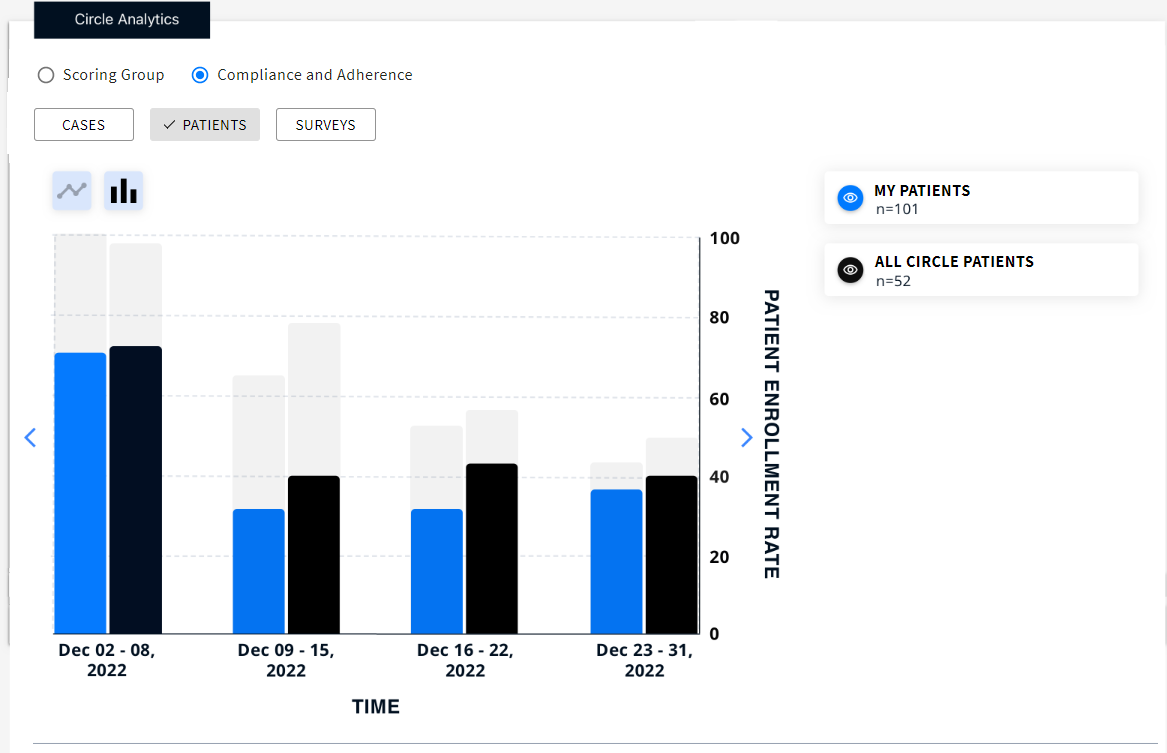
You can switch off/on the required column on the graph by clicking the corresponding eye icon on the right of the graph.
4. Hover your mouse over the required column to see the actual and the expected number of enrolled patients.
Actual - all patients joined the platform for the given period including self-enrolled patients + the rate to the expected number.
Expected - all the patients who are expected to join the platform for the given period as they have commencement date in this period.
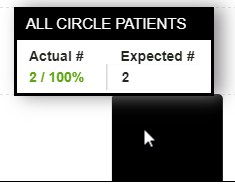
For example, looking at the image, we can see that 2 patients have registered, and the expected number of patients to register is 2, resulting in a completion rate of 100%.
Special Cases
- If a patient with two invitations to two different Circles gets registered to one of them - both cases are marked as enrolled.
- A case created for the existing patient is also taken into account for the Patient enrollment rate.